



Let me be direct with you. Every denied claim is not just a billing inconvenience. It is lost revenue, wasted staff time, and in many cases, a patient who ends up caught in the middle.
I have seen practices lose hundreds of thousands of dollars annually, not from bad medicine, but from fixable billing gaps. The industry finally has the data to prove it — and the tools to fix it.
What Is Claim Denial Management, Exactly?
Claim denial management is the systematic process of identifying, analyzing, appealing and preventing insurance claim denials within a healthcare revenue cycle. It covers both reactive appeals and proactive prevention, and its purpose is to protect the financial health of the practice rather than simply to process paperwork.
Before you set an internal denial-rate target, it helps to know what the rest of the market is actually running at. Marketplace issuers denied 18.7% of in-network claims in the CMS 2026 Transparency in Coverage file, with individual insurers ranging from 2.7% to 32.7%. Our insurance claim denial rate lookup breaks those figures out by payer, including appeal overturn rates and the reasons each issuer reported.
Denial or Rejection? The Answer Changes What You Do Next
The two words get used interchangeably on the floor, and it costs money. They are different events with different remedies, and working a rejection as though it were a denial burns an appeal you may need later.
| Rejection | Denial | |
|---|---|---|
| When it happens | Before adjudication. The claim fails a format or data edit at the clearinghouse or the payer’s front door. | After adjudication. The payer processed the claim and reached a negative determination. |
| What comes back | A clearinghouse or payer rejection report. | A remittance advice carrying adjustment and remark codes. |
| Is it a claim on file? | No. As far as the payer is concerned, it never arrived. | Yes. |
| The remedy | Correct the error and submit the claim. | Corrected claim, reopening or appeal, depending on why it was denied. |
| Filing-clock risk | High. The clock never stopped, because nothing was received. | The original filing date generally stands, but appeal deadlines now run. |
The filing exposure on rejections is the part most teams underestimate. A claim sitting in a rejection queue is not a claim on file, and the filing limit keeps running the whole time it sits there.
What the Denial Workflow Actually Looks Like
A denial arrives as codes, not sentences. A Claim Adjustment Reason Code (CARC) states why the paid amount differs from the billed amount. A Remittance Advice Remark Code (RARC) carries detail the reason code cannot convey on its own, and that is frequently where the actual instruction sits. Both lists are published by X12, with CMS maintaining the remark code list. They are revised on a schedule rather than continuously, so a code your system mapped a year ago can carry a different meaning today.
- Triage on arrival. Separate rejections from denials before anything else, because they go to different queues and only one of them has an appeal deadline.
- Read the codes together. Resolve the reason code and the remark code as a pair. Our denial code lookup handles the individual code; the value is in the pattern across a month of them.
- Decide: correct, or contest. If the denial is the result of something wrong on the claim — a wrong code, a missing modifier, a stale member ID — that is a corrected claim, not an appeal. If the payer understood the claim and still said no on the merits, that is an appeal. Some payers, Original Medicare among them, keep a separate reopening route for clerical errors, so check the payer’s own instruction before spending an appeal level on a typo.
- Answer the stated reason. An appeal that argues the care was appropriate, when the denial was about authorization, loses. Address the reason the payer gave.
- Trace it to a root cause, not a person. “Denied for authorization” is not a root cause. “Authorization was missed because the scheduling template does not flag this payer” is, and only the second version can be fixed.
- Close the loop upstream. Route the root cause back to whoever owns that step — registration, scheduling, coding, prior authorization — and confirm the fix held next month. A denial you appealed successfully but never traced will simply return.
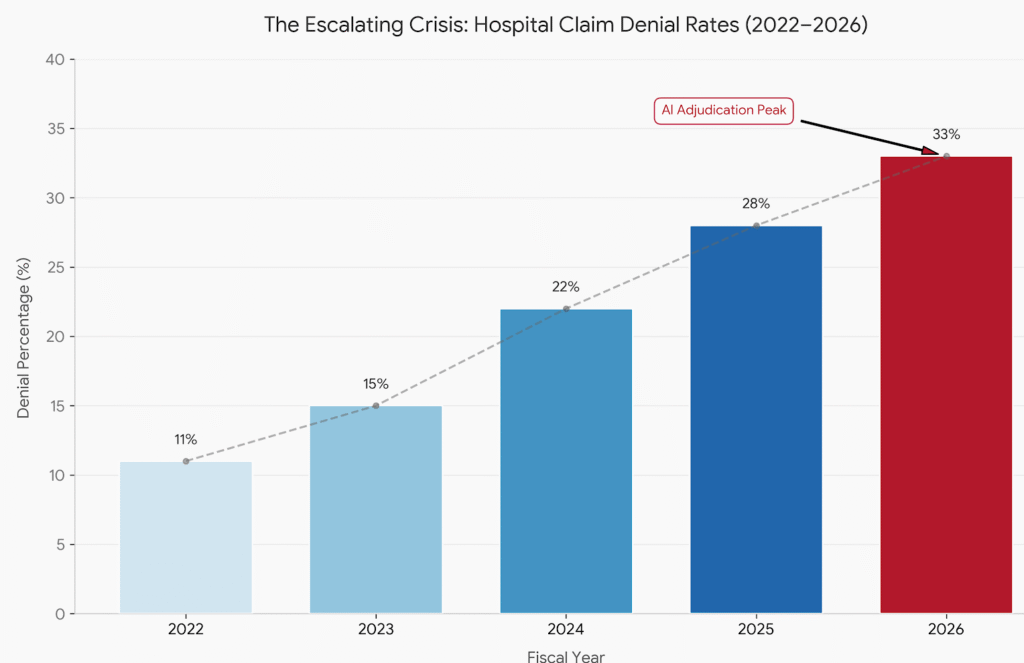
Why Are Denial Rates Still Rising in 2026?
The numbers are hard to ignore. In Experian Health 2025 State of Claims, 41% of providers said more than one claim in ten is denied, up from 30% when the survey began in 2022 and 38% in 2024. Headline denial percentages published by individual vendors and platforms vary widely depending on whose claims are being measured, so treat any single figure as a description of that data set rather than an industry average.
Three forces are driving this surge:
Payers are using AI offensively. Insurers now deploy machine learning to review claims at scale. This speeds up denials without proportionally speeding up approvals.
Regulatory complexity is compounding. The No Surprises Act, prior authorization reforms, and evolving Medicare Advantage rules have all added layers of compliance risk to every claim submitted.
Front-end data errors persist. Registration and eligibility mistakes remain the most common avoidable cause of denials, and they share one trait: they are created before the claim is ever coded. In Experian Health 2025 State of Claims, 54% of providers said claim errors are increasing and 68% said producing a clean claim is harder than it was a year earlier.
Meanwhile, denial rates have been climbing across both commercial plans and Medicare Advantage. This is not a niche problem. It is an industry-wide revenue crisis.
What Are the Most Common Reasons Claims Get Denied?
The top causes of claim denial are missing or inaccurate patient data, lack of prior authorization, incorrect coding, eligibility issues, and medical necessity disputes. These five categories account for the vast majority of preventable denials across all payer types.
Here is where most practices bleed revenue:
- Eligibility failures — Insurance details were not verified in real time before the visit.
- Authorization gaps — Services were rendered without required pre-approval, especially under Medicare Advantage plans.
- Coding errors — ICD-10 or CPT mismatches, often worsened by annual code updates.
- Duplicate submissions — Resubmitting before a payer responds creates automatic rejections.
- Medical necessity denials — Vague or incomplete clinical documentation fails to justify the service.
What separates high-performing practices is not that they never make these errors. It is that they catch them before submission.
How Much Does a Denied Claim Actually Cost You?
The administrative cost of working a denied claim has risen sharply in recent years. Multiply that across thousands of annual claims and the math becomes unsettling.
The revenue at stake is easier to reason about as a rate than as a headline figure. A denial nobody reworks is a total loss. One that is reworked costs staff time before it is paid. One that is prevented costs nothing at all. That ordering is why prevention economics beat recovery economics at any denial rate: the cheapest denial is the one that never leaves your office.
And the hidden cost? Staff burnout. The vast majority of denied claims require manual rework. That is repetitive, demoralizing work — and a major driver of turnover inside revenue cycle teams.
Is AI Actually Helping With Claim Denial Management?
It depends on which “AI” you are talking about — and that distinction matters more than most vendors will tell you.
Among the small share of providers currently using AI for denial management, many report it has reduced denials or improved resubmission success. Those results are real.
The labeling problem you need to know about
Most tools marketed as “AI-powered” to small and mid-size practices are rules-based engines — sophisticated claim scrubbers that flag a missing modifier, a blank field, or a mismatched payer ID. That is useful. It is not machine learning. It does not adapt when a payer quietly shifts its prior authorization criteria for a specific CPT code mid-year.
True ML-based denial prediction learns from remittance outcomes across tens of thousands of claims. It identifies which payer-code combinations are trending toward denial before your billing team notices the pattern. That capability requires high claim volume — typically 50,000 or more annually — clean structured data, and continuous retraining as payer behavior shifts. Most small practices simply do not generate that volume independently.
What this means for small practices
A solo practitioner or small group submitting 8,000 to 12,000 claims per year cannot train a meaningful proprietary model. When a vendor promises AI-driven denial prediction at that scale, ask them directly: what was the model trained on, how often does it retrain, and what is the minimum claim volume it requires? If they cannot answer clearly, you are buying a rules engine with better marketing.
The most practical path to genuine ML value for smaller organizations is through a third-party RCM partner that pools claims data across many practices. Aggregated datasets restore the volume needed for predictive accuracy — but only if that aggregator has sufficient claims within your specialty and regional payer mix. A model trained on urban oncology data will not reliably predict denial behavior under a rural BCBS contract.
The Deloitte Center for Health Solutions found that automated claim scrubbing and predictive validation — including both rules-based and ML approaches — can prevent up to 85% of avoidable denials and reduce administrative cost per claim by nearly 25%. That figure holds at scale. For small practices, the honest priority is clean claim scrubbing and real-time eligibility verification first, with ML-backed prediction accessed through an aggregated platform rather than a standalone tool.
What Does a Proactive Denial Prevention Strategy Look Like?
A strong denial prevention strategy combines clean front-end intake, real-time eligibility checks, pre-submission claim scrubbing, payer-specific coding rules, and a dedicated appeals workflow with root-cause tracking. Prevention costs far less than rework.
Start here:
1. Fix the front end first. Patient registration and insurance verification are where most denials originate. Real-time eligibility checks at scheduling — not just at check-in — catch problems before the appointment ever happens.
2. Centralize prior authorization workflows. Authorization management should be tracked in one system, not scattered across staff members’ inboxes. Automate reminders and expiration alerts.
3. Conduct quarterly coding audits. CPT codes change annually. Payer-specific rules change even more often. Scheduled audits with certified coders catch patterns before they become systemic denial trends.
4. Build a denial tracking dashboard. You cannot fix what you do not measure. Track denial rates by payer, denial code, provider, and service line. Look for patterns — not just individual errors.
5. Create a formal appeals process. Most providers appeal fewer than 10% of denied claims. Yet the MGMA notes that nearly two-thirds of denials are recoverable with the right workflow. A structured, timely appeals process is leaving money on the table if it is absent.
Should You Outsource Denial Management or Keep It In-House?
Outsourcing denial management works best for organizations without dedicated revenue cycle staff, high denial volumes, or recurring coding complexity. In-house teams offer more control and institutional knowledge, but require consistent training and the right technology stack.
A small orthopedic practice in Texas cut its denial rate meaningfully within one year of partnering with a specialized billing service — after implementing structured denial tracking, real-time eligibility checks, and coder retraining.
How Do You Measure Denial Management Success?
Track these key performance indicators every month:
| Metric | Target Benchmark |
|---|---|
| Clean claim rate | 95%+ |
| First-pass acceptance rate | 90%+ |
| Denial rate | Below 5% |
| Appeal success rate | 60%+ |
| Days to resolution | Under 30 days |
Any metric consistently outside these ranges signals a systemic gap — not a one-off error.
For deeper benchmarking, the American Health Information Management Association (AHIMA) maintains revenue cycle training and career resources: AHIMA Revenue Cycle Resources
What Should Small Practices Prioritize First?
Small practices should prioritize real-time eligibility verification and clean claim submission above all else. These two steps address the majority of preventable denials without requiring large technology investments or additional staff.
The return on even basic automation is immediate. One missed prior authorization can cost more than an entire month of a software subscription.
The Gap Most Competitors Miss
Most articles on this topic focus exclusively on appeals — the reactive end of the process. But the real opportunity lies upstream.
Prevention is always cheaper than appeals. A claim that never gets denied costs $0 to manage. A denied claim carries real administrative cost — and climbs from there with every appeal cycle, staff hour, and payer phone call.
The practices winning this game are treating denial management as a quality control function, not a billing department function. They involve clinicians in documentation review. They give schedulers denial-trend data. They tie coding accuracy to performance conversations.
That mindset shift is what separates a 3% denial rate from a 12% one.
Final Thought
Claim denial management is not an administrative nuisance. It is a clinical and financial discipline that touches every part of a healthcare organization — from front desk staff to the CFO.
The data is clear. Denials are rising. Costs are compounding. And the technology to reverse this trend exists today.
The practices that will thrive are not waiting for denials to arrive and then scrambling to appeal them. They are building systems that make the clean claim the default — not the exception.
Start with your data. Find your top three denial codes. Work backwards. Fix the root cause.
That is how you win.
Sources: Experian Health State of Claims 2025 | HFMA Revenue Cycle Data | Deloitte Center for Health Solutions 2024 | MGMA Benchmarking Report 2024 | American Journal of Managed Care 2025 | Advisory Board 2024
Underpayment by Insurers: Are You Leaving Money on the Table?
Unlike a denied claim, an underpayment is invisible. The claim was paid — just for less than the payer owed you. Because nothing bounces back, underpayments quietly drain revenue for months before anyone notices: practices can lose a meaningful share of revenue to this kind of leakage, which means a $2 million practice can be losing tens of thousands of dollars a year without a single denial on the books.
Underpayment happens when the payer reimburses below the contracted fee schedule for a CPT code — through a processing error, the wrong plan being applied, or downcoding of the service.
Where underpayments come from
The most common root causes are an incorrect fee schedule applied to the claim, outdated contracted rates, an incorrect plan type applied, improper bundling of services that should have paid separately, and an incorrect procedure code. Any of these can shave a few dollars off hundreds of claims.
How to find them: contract variance analysis
The reliable way to catch underpayments is contract variance analysis — comparing every payment received against the contracted allowed amount for that CPT code. Small, systematic shortfalls add up fast: a $12 underpayment on a code you bill 400 times a month is $4,800 a month in recoverable revenue.
One distinction matters here: an underpayment is not the same as a contractual adjustment. A contractual adjustment is the legitimate difference between your billed charge and the contracted rate; an underpayment is what is missing below the contracted rate. Many billing systems post both to the same bucket, which is exactly how underpayments stay hidden.
Recovering and preventing underpayments
Recovery starts with a formal recoupment or corrected-payment dispute with the payer — and timing matters. Act within the payer’s timely dispute window, typically 90–180 days after the payment posted. Your first operational steps are to build queryable contracts that store the expected payment for each CPT code, and to run systematic variance reports that flag every payment below that amount.
The same data doubles as leverage at the negotiating table: underpayment patterns plus published benchmarks from MGMA and AAPC give you documented evidence when you push for better contracted rates.
Underpayment questions, answered
How common are underpayments? There is no reliable public figure for how often payers underpay — which is part of why the problem persists.
Can you dispute an underpayment after the timely window? Options are limited once the window closes, though some state prompt-payment laws provide additional recourse.
What software helps? Contract management and analytics platforms such as Waystar, Experian Health, and Availity can automate variance analysis at scale.
Leave a Reply