
What exactly did CMS cut with the 2026 efficiency adjustment, and how permanent is it?
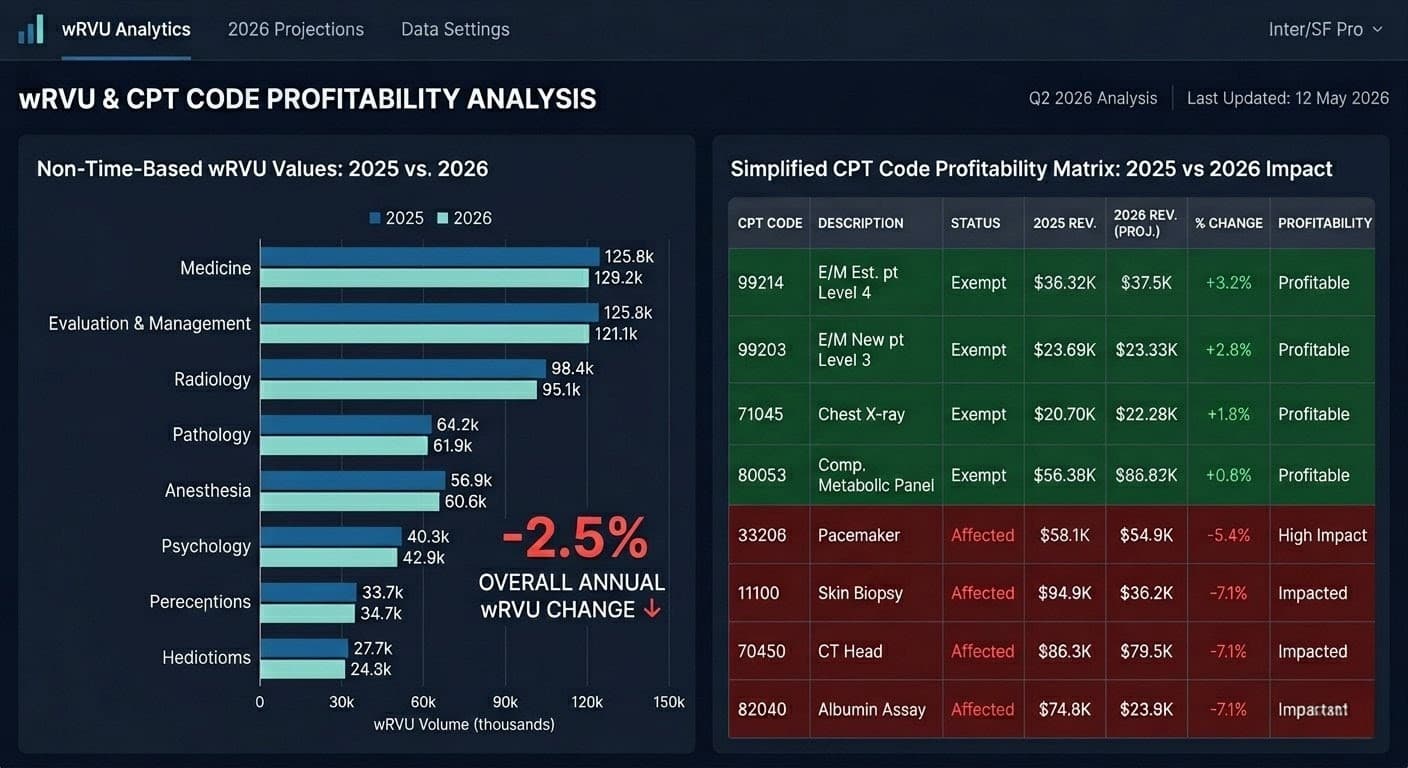
CMS finalized a -2.5% reduction to work RVUs and corresponding intra-service physician time for all non-time-based CPT codes effective January 1, 2026. The cut applies to approximately 8,960 procedural, surgical, diagnostic, and imaging codes. CMS intends to apply this efficiency adjustment every three years, with no stated floor, making it a permanent structural drag on specialty reimbursement going forward.
The mechanics are deliberate and the target is specific. CMS applied its MEI productivity adjustment — a tool historically reserved for hospital outpatient payment systems — to physician work values for the first time. The agency’s logic: procedures get easier as physicians gain experience, therefore the work value should decline. The AMA contested this directly, citing a peer-reviewed JACS study of 1.7 million operations across 249 CPT codes showing operative times increased 3.1% from 2019 to 2023 — not decreased.
The argument didn’t move CMS. The cut is finalized.
Which physician specialties absorb the worst financial damage from this rule?
Procedural and diagnostic specialties bearing the highest share of non-time-based CPT volume face the steepest net reimbursement compression. Gastroenterology, interventional cardiology, orthopedic surgery, interventional radiology, urology, and ophthalmology all carry dominant non-time-based service mixes. For these groups, the -2.5% wRVU reduction partially or entirely offsets the headline 3.26% conversion factor increase, producing a net reimbursement gain of approximately 1% or less — before inflation.
The compounding hit is worse for facility-based specialists. CMS simultaneously finalized a 50% reduction to indirect PE RVU allocations for facility-site-of-service claims. Hospital-based proceduralists face a dual exposure: efficiency adjustment eroding work value, PE restructuring gutting the practice expense component. The AAPC analysis confirms this one-two combination creates severe reimbursement pressure for facility-based procedural services that can overwhelm the positive conversion factor adjustment entirely.
Time-based services — E/M visits, behavioral health, chronic care management, maternity global codes, and most telehealth — are fully exempt from the efficiency adjustment. Primary care and psychiatry practices collect the conversion factor gain without the wRVU haircut. This isn’t accidental. The MPFS architecture now structurally rewards time-based cognitive work and penalizes procedural volume. That inversion matters for long-range service line strategy.
How does the efficiency adjustment actually reduce payment at the claim level?
The efficiency adjustment does not reduce payment by 2.5% on a one-to-one basis. The Medicare payment formula is: (Work RVU × Work GPCI) + (PE RVU × PE GPCI) + (MP RVU × MP GPCI) × Conversion Factor = Allowed Amount. The -2.5% cut applies only to the work RVU component, which represents roughly 51% of total RVU value. The AMA estimates this translates to approximately a 1% reduction in total reimbursement per affected code — compounded by practice-specific specialty mix.
This distinction matters operationally. A surgical practice billing CPT 27447 (total knee arthroplasty) under non-facility rates sees the work RVU drop from 20.02 to approximately 19.52. The conversion factor gain partially restores dollar-per-unit value, but only where wRVU volume is high enough to feel that recovery. A practice doing 40% facility-based procedures and 60% office-based procedures experiences a bifurcated impact — one payment stream recovering, the other compressing — that standard P&L reporting will obscure unless service-line margin accounting is operating at CPT resolution.
Most practices aren’t running at that resolution. That’s the operational risk gap that matters most right now.
What is the most effective first step to quantify the real revenue impact on your practice?
The highest-leverage first action is a CPT-level service mix profitability analysis that maps your 2025 claim volume against 2026 wRVU values, then segments each code by affected vs. exempt status, facility vs. non-facility site of service, and direct cost per procedure. This analysis requires pulling 12 months of CPT volume data from your practice management system, applying CMS’s updated 2026 wRVU table, and computing the net dollar delta at total claim volume — not per-unit. That delta is your exposure number.
Pull your top 20 CPT codes by claim volume. Cross-reference each against the CMS 2026 MPFS final rule addenda [https://www.cms.gov/medicare/physician-fee-schedule/search] to confirm current wRVU values. Segregate every code into three buckets: exempt (time-based), affected with partial conversion factor recovery, and affected with net loss after recovery. Assign the prior 12 months of claim volume to each bucket. That matrix — not a headline rate change estimate — is your actual revenue exposure.
Most practices stop at identifying which codes are affected. The tactical gap is going one level deeper: identifying which affected codes are also your highest direct-cost procedures. A procedure with a 2.5% wRVU cut that also carries $400 in direct clinical supply cost per case is a different problem than a low-supply diagnostic procedure. The efficiency adjustment doesn’t touch your cost structure — only your revenue unit. Margin compression is therefore asymmetric, concentrated in high-supply procedural work.
How should a practice adjust its expense tracking to survive the -2.5% RVU clawback?
Practices must build a per-procedure direct cost log mapping supply costs, staff time, and equipment depreciation to individual CPT codes — then compare that overhead per unit against the adjusted 2026 reimbursement per unit to identify which services are margin-negative under the new values. Any CPT code where the 2026 allowed amount minus direct cost falls below your minimum viable margin threshold requires operational intervention before the revenue cycle compound the loss through denials.
This sounds basic. It almost never happens below the departmental budget level in practice.
Build a spreadsheet with five columns: CPT code, 2025 wRVU, 2026 wRVU, net reimbursement change in dollars, direct cost per case. Sort descending by volume. Every code in the top 20 by claim count where Column 5 is greater than 60% of Column 3 is a priority target. These are your margin-thin, high-volume procedures now made worse by the cut. Your choices are three: renegotiate commercial payer contracts on those codes, shift those procedures to a lower-cost delivery setting, or accelerate documentation capture for the highest complexity modifier justified.
The PE RVU redistribution creates one underutilized offset. CMS is increasing indirect PE RVU allocations for office-based services while cutting facility-based allocations. Practices with procedures that can migrate from a hospital outpatient department to an office setting — or to an ASC where PE allocations are calculated differently — can capture a net payment improvement that partially replaces the wRVU loss. CMS’s own data show office-based PE allocations gaining 4% while facility-based services lose 7%. Site-of-service optimization is no longer a scheduling preference. It’s a revenue recovery strategy.
Does APM participation materially change a practice’s exposure to these cuts?
Qualifying APM participants receive a conversion factor of $33.57 versus $33.40 for non-participants — a 0.51% spread that compounds across total Medicare claim volume. The AMA confirmed that 528,827 clinicians achieved QP status for 2026 based on 2024 participation in advanced APMs. Those clinicians also receive a 1.88% APM lump-sum bonus payment. For a specialist generating $800,000 in Medicare revenue, that bonus alone represents approximately $15,000 in direct recovery against efficiency adjustment losses.
The pathway to QP status runs through advanced APMs: Medicare Shared Savings Program ACOs, TEAM (Transforming Episode Accountability Model), and Bundled Payment programs. Practices not currently enrolled should model their 2026 claim volume against the QP threshold requirements immediately. CMS has raised threshold criteria under current law, meaning the window for qualifying narrows as procedural wRVU values shrink — a counterintuitive consequence of the efficiency adjustment that most compensation consultants haven’t flagged publicly.
What compliance risks does compensation restructuring create under Stark Law and the False Claims Act?
Adjusting per-wRVU conversion factors to hold physicians harmless from the efficiency cut creates a Stark Law commercial reasonableness risk if the resulting compensation per wRVU rate exceeds MGMA or AMGA benchmarks for that specialty — even if the physician’s clinical output is unchanged. OIG scrutiny of physician compensation arrangements post-2026 will focus precisely on practices that artificially elevated dollar-per-wRVU rates to offset the CMS adjustment. The False Claims Act exposure is real and direct: a compensation model that pays above fair market value becomes the mechanism for unlawful referral inducement.
Document the business justification for any compensation model change made in response to the efficiency adjustment before executing it. Engage a healthcare attorney to conduct a Stark Law commercial reasonableness review [https://oig.hhs.gov/compliance/physician-education/] against current MGMA benchmarks for the specific specialty and service mix. Shadow wRVU tracking — crediting physicians with pre-2026 wRVU values while compensating against them — is emerging as a transitional approach, but it requires explicit FMV support and a time-limited sunset clause to avoid hardening into a permanent above-market pay structure.
The 2026 MPFS changes aren’t just a revenue problem. For any practice with employed physicians on wRVU-based compensation, they’re a governance and legal compliance event. Treat them as such.
Data sourced from the CMS CY 2026 Medicare Physician Fee Schedule Final Rule (CMS-1832-F), American Medical Association 2026 MPFS Final Rule Summary and Analysis, AAPC Knowledge Center 2026 MPFS analysis, MGMA 2026 RVU impact guidance, and the American College of Cardiology 2026 PFS efficiency adjustment explainer.
Leave a Reply