

What Exactly Does “APM Compliance Cost” Mean in 2026?
In 2026, APM compliance cost encompasses every operational dollar a practice spends to qualify for, participate in, and sustain Advanced Alternative Payment Model status under the CMS Quality Payment Program — including CEHRT licensing, attribution modeling, quality reporting labor, and the administrative burden of performance documentation required for Qualifying APM Participant status.
The distinction matters because most practice administrators conflate compliance cost with billing overhead. They are not the same animal. Under the CY 2026 Medicare Physician Fee Schedule Final Rule (CMS-1832-F), CMS implemented two separate conversion factors: $33.57 for qualifying APM participants and $33.40 for non-qualifying APM participants — a spread that grows into real money fast when applied across a multi-provider group’s full Part B claims volume. Consumer Financial Services Law Monitor
That delta is your benefit numerator. The compliance infrastructure you build to capture it is your cost denominator. Tracking the ratio between them is the only financially defensible way to run an APM-enrolled practice in 2026.
How Do You Build a Compliance Cost Baseline for APM Participation?
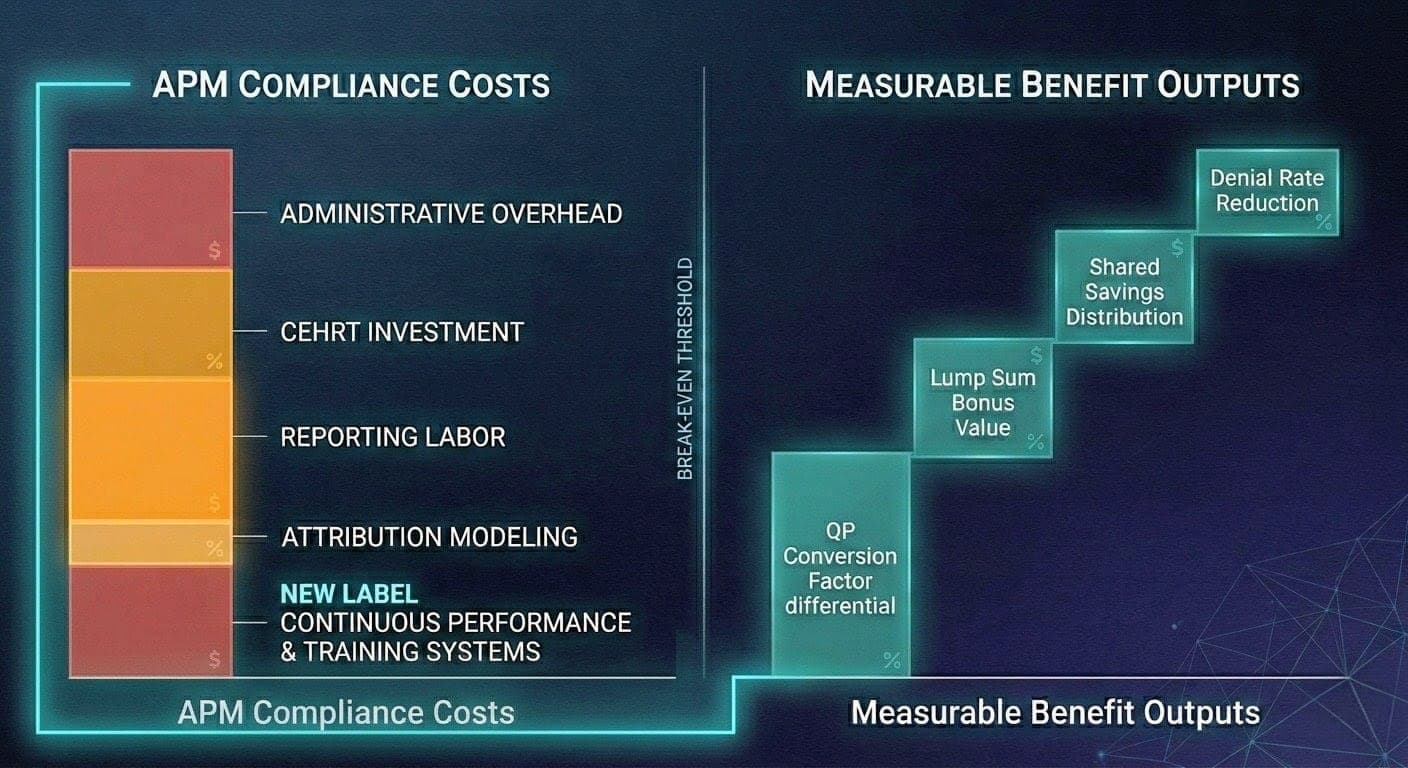
A compliance cost baseline for APM participation is constructed by cataloging four expense categories: (1) technology — CEHRT licensing and interoperability infrastructure required by Advanced APM statute; (2) reporting labor — FTE hours or vendor costs allocated to quality measure data submission, attribution reconciliation, and QPP portal management; (3) administrative overhead — legal, compliance officer, and payer negotiation time; and (4) model-specific operational changes, such as care management workflows mandated under ACO or TEAM participation.
Build this baseline before a single performance period closes. You cannot demonstrate ROI on an investment you never measured at the start. Run the four categories through a total cost model: licenses plus support plus infrastructure plus third-party services, itemized per clinician. This gives you a per-eligible clinician (EC) cost figure that maps directly against the individual-level QP determination framework CMS finalized for 2026.
The individual-level calculation is a structural change that most billing teams have not operationalized yet. CMS will begin making QP determinations at both the individual clinician level and the APM Entity level, offering more granular eligibility tracking — and the QP calculation will be expanded to include all Covered Professional Services, not just E/M services. That expansion changes your attribution math. If your cost baseline was built on E/M-only volume, it understates your eligible revenue pool and distorts your ROI projection. MDinteractive
What Are the Primary Benefit Metrics to Quantify Against APM Compliance Costs?
The primary benefit metrics for APM compliance ROI are: (1) the QP conversion factor differential — $0.17 per relative value unit between QP and non-QP rates in 2026; (2) the APM lump sum incentive payment, which CMS finalized at 1.88% for payment year 2026 based on 2024 participation; (3) shared savings distributions from ACO or episode-model participation; (4) denial rate reduction attributable to value-based documentation discipline; and (5) audit exposure avoided by maintaining proactive compliance infrastructure.
CMS announced 528,827 eligible clinicians achieved QP status in 2024, making them eligible for the 3.77% payment increase in 2026, along with a 1.88% APM lump sum bonus payment. That 1.88% figure carries a structural urgency: payment year 2026 is the last year for the APM Incentive Payment under current law. Congress would need to act to extend it. Any cost-benefit model that treats this bonus as a recurring revenue line into 2027 is built on a legal fiction. AMA summary of the 2026 Medicare Physician Payment Schedule and QPP final ruleASA
Capture each benefit stream in a separate ledger line. Aggregate them only at the final ROI stage. Mixing conversion factor gains with shared savings distributions before you’ve pressure-tested each component produces the kind of optimistic number that misleads a CFO and collapses in a board presentation.
How Do You Calculate the True ROI Spread Between QP and Non-QP Status?
The true ROI spread between QP and non-QP Medicare participation is calculated by multiplying the conversion factor differential ($0.17) by each provider’s projected total Medicare Part B RVUs for 2026, then adding the 1.88% lump sum bonus applied to base-year covered professional services payments, then subtracting total compliance costs on a per-clinician basis — producing a net per-EC gain or loss.
Run this model for each clinician on your roster, not just at the entity level. The dual-threshold calculation CMS introduced means a clinician can achieve QP status through either the entity-level or individual-level pathway. A group that manages 30 physicians may find that 22 clear QP thresholds individually even if the entity as a whole falls short. Each eligible clinician who achieves QP status captures the full conversion factor benefit regardless of whether adjacent clinicians in the same group qualify.
The ROI spread widens further when you fold in the TEAM model’s episode-based risk corridors. The mandatory Transforming Episode Accountability Model (TEAM) began on January 1, 2026, introducing compulsory episode-based payment accountability for selected hospital outpatient procedures. Practices affiliated with TEAM-participating hospitals now carry cost-and-quality accountability that did not exist in their 2025 compliance budgets. If your cost baseline predates TEAM’s effective date, rebuild it. ASA
What Financial Risks Does Poor APM Cost Tracking Create?
Poor APM cost tracking creates three categories of financial risk: (1) revenue leakage from failing to achieve QP status due to unmonitored participation thresholds; (2) False Claims Act exposure from inaccurate cost measure reporting or upcoding under value-based documentation protocols; and (3) shared savings forfeiture when attribution and utilization data are not validated against benchmark expenditure targets in time for reconciliation.
The False Claims Act risk is not theoretical. The OIG’s active 2026 Work Plan specifically targets E/M coding accuracy and documentation integrity across physician practices, with predictive modeling now replacing random sampling in audit selection. Under the False Claims Act, identified Medicare overpayments must be returned to the government within 60 days of identification. Practices operating in APMs produce substantially more documentation than fee-for-service counterparts. That volume amplifies the exposure surface. A retrospective audit finding on a value-based care cost measure can trigger a False Claims Act investigation with far higher stakes than a single denied claim. Medical Billers and Coders
Revenue leakage on the QP side is quieter but equally damaging. A practice that misses the QP threshold by five percentage points forfeits the $0.17 per-RVU conversion factor premium across its entire Medicare Part B volume for the year. On a 20-provider group billing 150,000 RVUs annually, that gap costs approximately $25,500 in lost Medicare revenue — before accounting for the forfeited 1.88% lump sum payment.
How Should You Structure Ongoing Metric Tracking Through the Performance Year?
Ongoing APM compliance metric tracking should follow a three-cadence model: monthly reviews of QP participation thresholds using the QPP Participation Status Tool; quarterly governance reviews of cost measure performance against benchmark expenditure targets; and an annual model recalibration that adjusts cost baselines, updates benefit projections based on actual shared savings distributions, and recertifies CEHRT configurations against the CMS electronic health record requirements for Advanced APM eligibility.
MIPS payment adjustments and the APM incentive are based on performance two years prior to the payment year — performance in 2026 will determine payments in 2028. This two-year lag is operationally treacherous. Decisions your coders and care coordinators make today do not manifest as payment consequences until two fiscal years from now. A practice without a forward-looking performance dashboard — one that maps current-year cost measure data to projected 2028 payment adjustments — is flying blind. Society of Hospital Medicine
The monthly QP threshold check is non-negotiable. CMS makes QP determinations three times per year: March 31, June 30, and August 31. A practice that first checks its threshold status in August has already surrendered two correction windows. Map each determination snapshot against your current payer mix, attribution roster, and service volume. If you are trending below the QP payment threshold, escalate immediately to your APM entity administrator — not at year end.
What Compliance Technology Infrastructure Does Accurate APM Tracking Require?
Accurate APM compliance tracking requires a technology stack built on three layers: a CEHRT-certified EHR platform meeting CMS’s 2015 Edition health IT certification requirements for Advanced APM eligibility; a population health or quality reporting module capable of generating APM Performance Pathway (APP) Plus measure data at the patient level; and a financial analytics layer that integrates Medicare payment data with RCM reporting to calculate per-clinician net collection rate, Days in A/R, and cost measure performance concurrently.
CMS finalized a 2-year informational-only feedback period for new cost measures, allowing clinicians to receive feedback on their scores and find opportunities to improve performance before a new cost measure affects their MIPS final score. Use that feedback window aggressively. Extract your cost measure data from the QPP portal after each determination period. Run it through your financial analytics layer to identify where your per-beneficiary per-month spend exceeds your benchmark. Then trace the excess back to specific service categories — imaging, post-acute utilization, specialist referral patterns — and quantify the revenue impact of closing those gaps before they harden into payment penalties. eCQI Resource Center on 2026 Quality Payment Program policy changes
The technology investment is a compliance cost line item. It belongs in your baseline. A practice that spends $80,000 annually on population health software and quality reporting infrastructure but has never modeled that expenditure against its QP conversion factor gains and shared savings distributions does not have a compliance program. It has a compliance expense.
Track costs against benefits with the same precision you apply to your denial rate — monthly, by clinician, by model. That discipline is what separates practices that profit from APM participation from those that merely survive it.
For authoritative APM participation data and QPP threshold requirements, refer directly to CMS Quality Payment Program (qpp.cms.gov) and the 2026 MPFS Final Rule Summary published by the AMA (ama-assn.org).
Leave a Reply